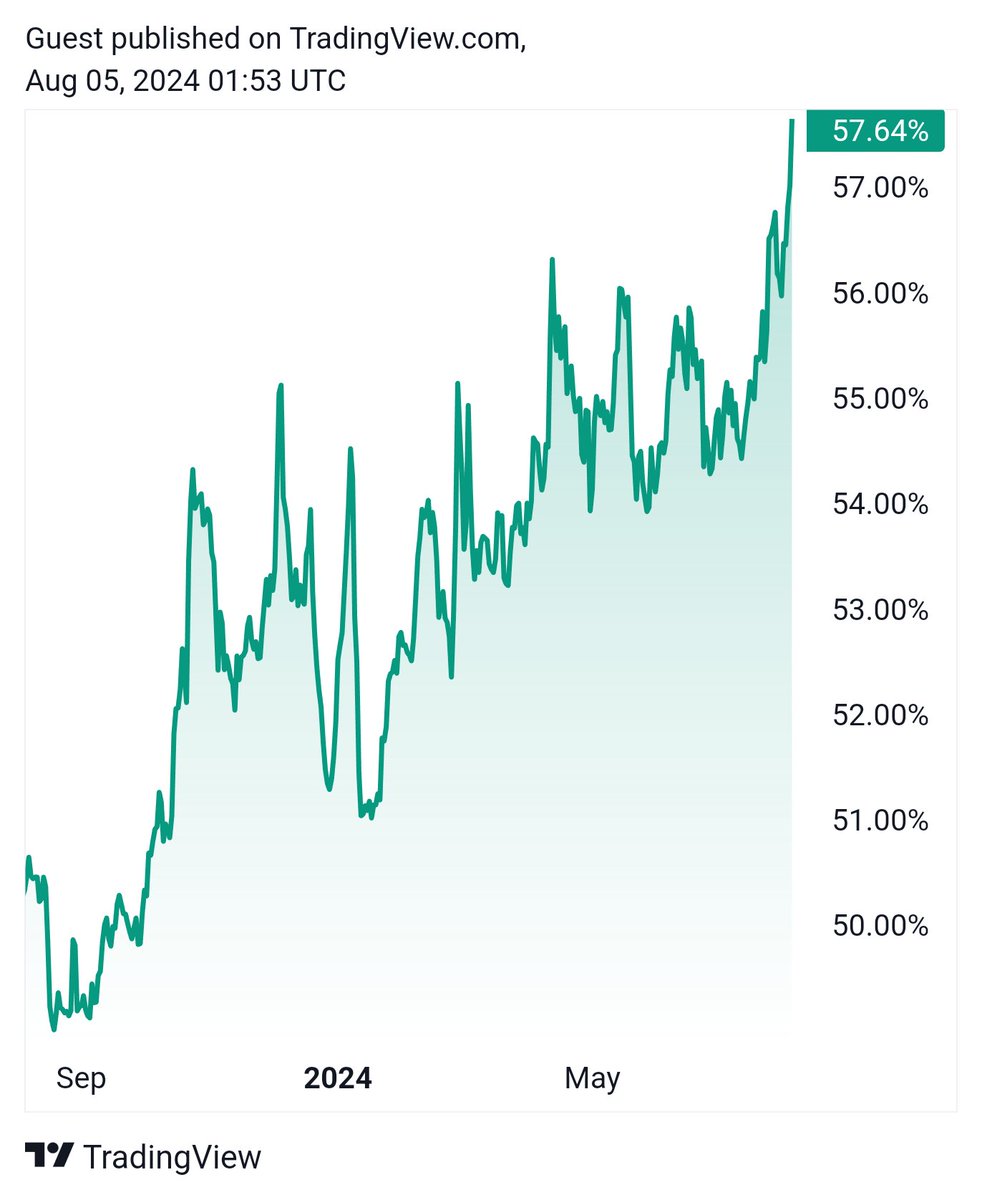
Bitcoin dominance chart today.
𝕏/@lopp •
Revision history
5 recorded changes
Want your article here?
Promote with Leviathan News5 recorded changes
Want your article here?
Promote with Leviathan NewsJameson Lopp shared a snapshot of the Bitcoin dominance chart, highlighting Bitcoin’s current share of the total crypto market capitalization hovering in the mid‑ to high‑50% range, depending on the data provider. Bitcoin dominance measures Bitcoin’s market cap as a percentage of the overall crypto market and is widely tracked via indices such as TradingView’s BTC.D and dashboards from CoinGecko, CoinMarketCap, and others. As of mid‑June 2026, these sources show Bitcoin accounting for roughly 56–59% of the crypto market, a level near the upper end of its typical bull‑market range. The post comes in the context of renewed discussion around how capital is allocated between Bitcoin and altcoins during this market cycle. Historically, dominance tends to rise when market participants consolidate into Bitcoin (often during risk‑off phases or early bull runs) and to fall when speculative flows rotate into smaller tokens later in the cycle. Analysts and traders use this chart as a sentiment and liquidity gauge: elevated dominance suggests Bitcoin is capturing most inflows and setting the tone for the broader market, while subdued dominance is associated with stronger relative performance from altcoins. Lopp’s focus on the chart underscores Bitcoin’s continued central role in crypto market structure and the ongoing debate over whether current levels signal a Bitcoin‑led phase or a potential setup for a future “altseason.”
AI-generated background, compiled from web sources — not editorial content.

Coindesk ·

The Block ·

𝕏/@swissbitcoinpay ·
𝕏/@_ALCPB ·

Coindesk ·

The Block ·
Coindesk ·
The Block ·
𝕏/@swissbitcoinpay ·
𝕏/@_ALCPB ·
Coindesk ·
The Block ·
🚀 Love DeFi? Ready to dive in and start earning $SQUID while making an impact?