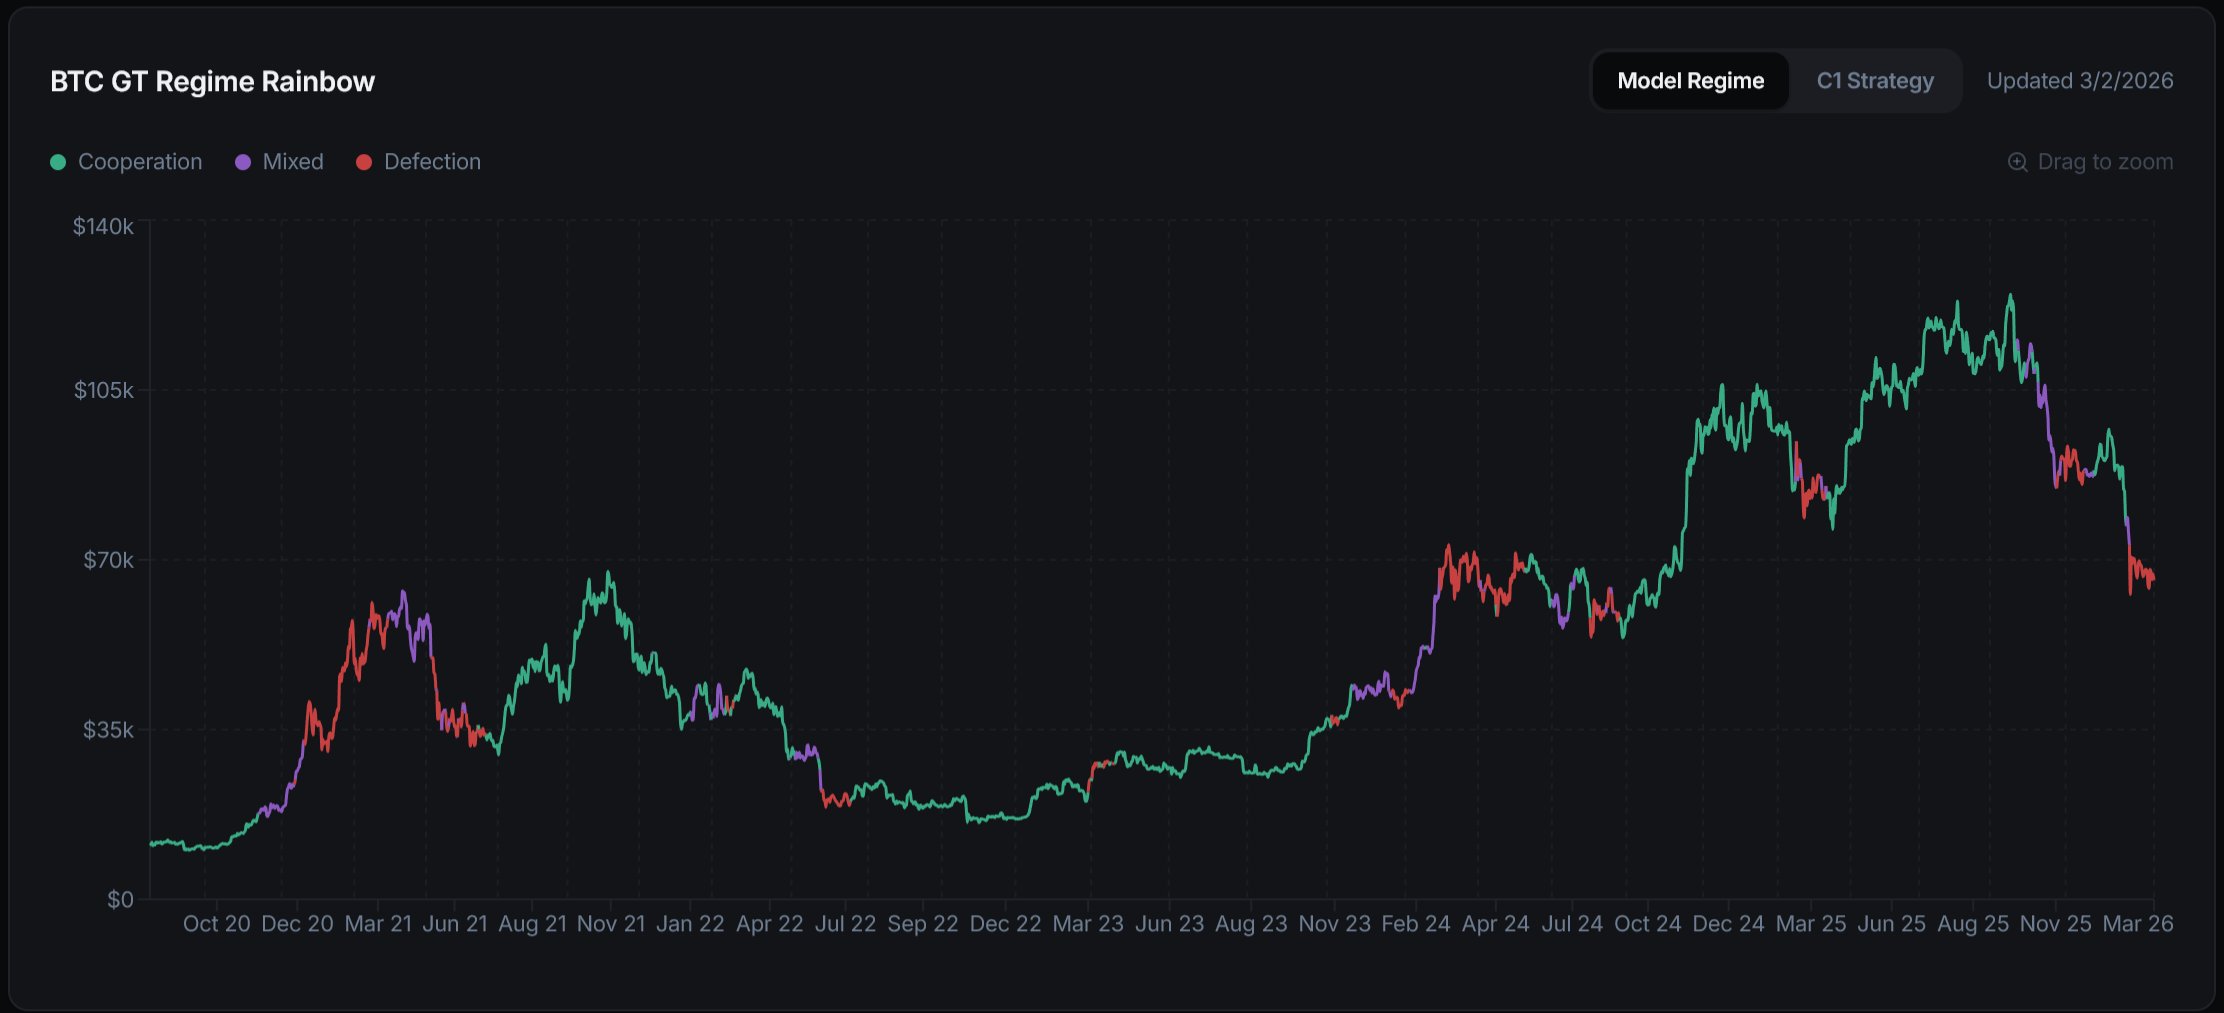
The Game Theory Rainbow Chart tracks when Bitcoin shifts from coordinated accumulation to self-interested defection regimes

9 recorded changes
Want your article here?
Promote with Leviathan News

9 recorded changes
Want your article here?
Promote with Leviathan NewsDelphi Digital has introduced a "Game Theory Rainbow Chart" that reframes Bitcoin’s classic rainbow-style valuation bands in terms of game-theoretic behavior regimes, aiming to identify when market participants shift from coordinated accumulation to self-interested selling or "defection" behavior. While traditional Bitcoin rainbow charts plot price on a long-term logarithmic curve with colored bands labeled with memes like "HODL" or "Fire Sale," they explicitly lack a scientific or predictive foundation and are meant mainly as a visual heuristic for historical price cycles. Delphi’s version builds on this visual language but interprets each band as reflecting different strategic incentives among holders and traders, such as phases of accumulation, FOMO-driven buying, profit-taking, and eventual capitulation or defection, grounded in game-theory concepts of cooperation versus self-interest in a repeated, competitive market. In this framework, lower bands in the chart correspond to a coordinated accumulation regime where long-term holders and large players behave more like cooperative actors, collectively absorbing supply as prices are relatively low and volatility has compressed after a drawdown, similar to an “accumulation phase” in traditional cycle analysis. As Bitcoin’s price climbs through higher bands, incentives shift: short-term speculators and some long-term holders are increasingly rewarded for defecting from the cooperative strategy by taking profits, exiting positions, or front-running others’ selling, an application of standard game-theory reasoning where payoff structures change as conditions evolve. By labeling and tracking these behavioral regimes over past cycles, the Game Theory Rainbow Chart is intended as a narrative and analytical tool for understanding how strategic incentives among Bitcoin participants change across bull and bear markets, rather than as a precise price-forecasting model—mirroring the caveats attached to earlier rainbow charts that warn against treating the bands as deterministic signals.
AI-generated background, compiled from web sources — not editorial content.

Coindesk ·

𝕏/@motionbynick ·

Coindesk ·

𝕏/@coinspect ·

prtimes.jp ·

𝕏/@RadarChat ·

Coindesk ·

𝕏/@motionbynick ·

Coindesk ·

𝕏/@coinspect ·

prtimes.jp ·

𝕏/@RadarChat ·
🚀 Love DeFi? Ready to dive in and start earning $SQUID while making an impact?