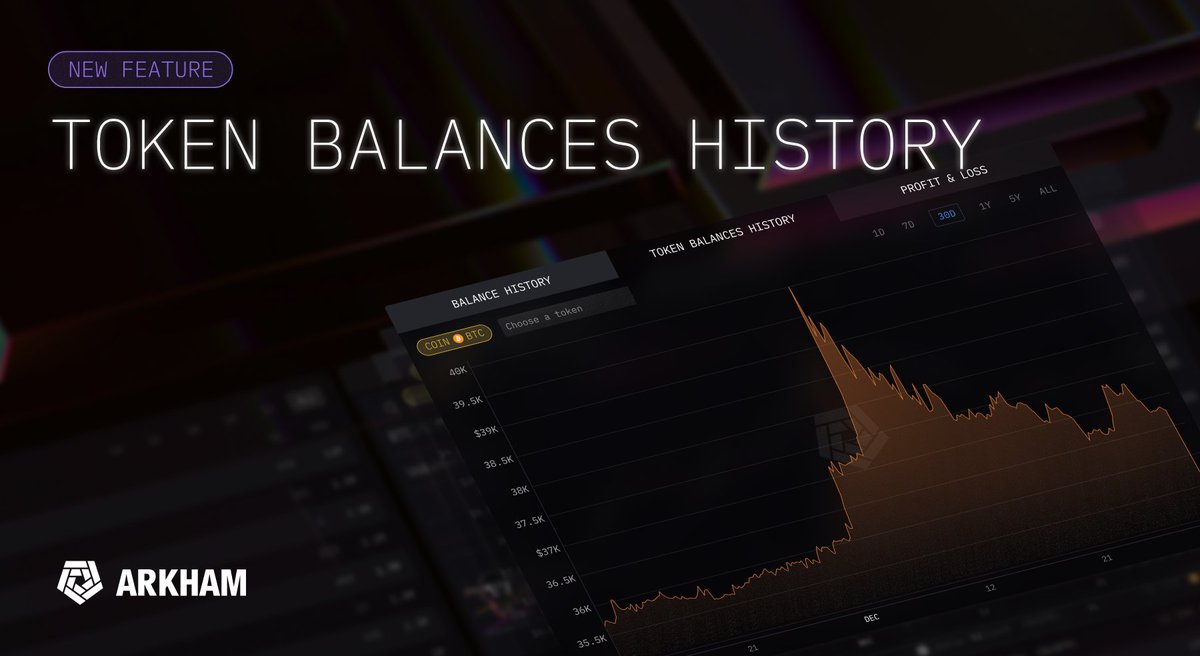
Announcing Token Balance Charts! You can now view specific token balances over time for ANY token on ANY address/entity on Arkham.
𝕏/@ArkhamIntel •
Revision history
7 recorded changes
Want your article here?
Promote with Leviathan News7 recorded changes
Want your article here?
Promote with Leviathan NewsArkham Intelligence, an on-chain analytics platform, has launched a new Token Balance Charts feature that lets users visualize the historical balance of any specific token for any address or labeled entity on the platform. Previously, Arkham only exposed this information at discrete timestamps via its Portfolio Archive, but users can now generate time-series charts covering the full lifetime of an address or entity. According to Arkham’s announcement, the charts work for "ANY token on ANY address/entity" tracked on the platform, turning raw balance history into a visual timeline of holdings and movements. This enables users to examine how token positions have evolved for both individual wallets and large entities such as BlackRock, Robinhood, or Tesla, by overlaying market or news events with changes in on-chain balances. The feature is particularly relevant for analysts, researchers, and traders who monitor whale activity, institutional flows, or the behavior of known entities, since it simplifies the process of spotting accumulation, distribution, and other strategic moves over time. The update also fits into a broader trend of increasingly granular on-chain data tools aimed at improving transparency and enabling more sophisticated blockchain forensics and market analysis. By shifting from static snapshots to continuous historical views, Arkham’s Token Balance Charts lower the friction of investigating wallets, tracing fund movements, and contextualizing trading or governance actions using on-chain records.
AI-generated background, compiled from web sources — not editorial content.

𝕏/@arkham ·

𝕏/@arkham ·

info.arkm ·

The Block ·
𝕏/@arkham ·

𝕏/@arkham ·
𝕏/@arkham ·
𝕏/@arkham ·
info.arkm ·
The Block ·
𝕏/@arkham ·
𝕏/@arkham ·
🚀 Love DeFi? Ready to dive in and start earning $SQUID while making an impact?